
WordPress Site Slow? How to Test It and Read the Results
Slow is a feeling, not a diagnosis. A half-hour method to measure a slow WordPress site with free tools and read the numbers.

zabil

“My WordPress site is slow” is a feeling, not a diagnosis. Before anything gets fixed, you need numbers: which pages are slow, on which devices, and where the time is going. The good news is that you can collect all of it in about half an hour using free tools. This guide shows how, and how to read what comes back.
It is a companion to our guide on why a WordPress site loads slowly and what to check first, which explains the causes. This one explains how to find out which of those causes is yours.
Step 1: Start with real visitor data
Lab tests are useful, but the first question is how the site performs for real people. Two free places show that:
- Google Search Console. Open the Core Web Vitals report. It groups your pages into good, needs improvement and poor, for mobile and desktop, using data from real Chrome users.
- PageSpeed Insights. Enter a URL and look at the section at the top called “Discover what your real users are experiencing”. If the page has enough traffic, you will see real-world results for it.
Small sites often do not have enough visits to appear in either. That is normal, and it simply means you will rely on lab tests in the next step.
Step 2: Run a lab test on the pages that matter
Test the pages that carry your business, not just the homepage: a main service page, a blog post and your contact page. Use PageSpeed Insights, GTmetrix or WebPageTest, and keep a few habits in mind:
- Test on mobile first. Most visitors to a local business site arrive on a phone.
- Run each test two or three times. A single score can swing between runs, so look for the pattern rather than the number.
- Ignore the big score at first. The individual measurements and the list of suggestions are what tell you what to do.
Step 3: Read the numbers
Each measurement points at a different part of the site. This is how we read them.
- Server response time (TTFB). How long the server takes to send the first byte. Google’s guidance on TTFB treats 0.8 seconds or less as good, and lower is better because it uses up part of your 2.5-second budget for the main content. A high number points to hosting, missing page caching, an outdated PHP version or a slow database.
- Largest Contentful Paint (LCP). When the biggest visible element appears, and the target is 2.5 seconds or less. The report tells you which element that is. If it is a large hero image, look at image size and format. If it is a heading, look at slow servers and render-blocking files.
- Interaction to Next Paint (INP). How quickly the page reacts when someone taps or clicks, with a target of 200 milliseconds or less. Slow responses are usually caused by too much JavaScript, often from plugins, chat widgets and tracking tags.
- Cumulative Layout Shift (CLS). How much the page jumps around while loading, with a target of 0.1 or less. Common causes are images without set dimensions, late-loading fonts and banners that push content down.
Step 4: Look at what the browser is actually loading
In Chrome, right-click the page, choose Inspect, and open the Network tab. Tick “Disable cache”, reload the page and sort the list by size and then by time. Two things usually stand out quickly:
- A few very large files, most often images that are far bigger than the space they fill.
- A long tail of requests to other domains, such as fonts, maps, chat tools, video embeds and analytics. Each one is outside your server’s control and adds waiting time.
Step 5: Look inside WordPress
The browser tells you what is slow. To learn why, look at WordPress itself.
- Site Health. Under Tools in your dashboard, Site Health shows your PHP version and flags performance and security issues in plain language.
- Query Monitor. This free plugin shows slow database queries, which plugin or theme caused each one, and which scripts and styles load on the current page. Use it while you investigate, and preferably on a staging copy of the site. Remove it when you are done.
You are looking for plugins that run heavy queries on every page, and for scripts and styles from plugins that load on pages where they are not used.
Is it slow only in the admin dashboard?
That is a different problem. Page caching does not help when you are logged in, so a slow dashboard usually points to limited server resources, heavy plugins that run in the admin area, or a database that has grown untidy over the years. Site Health and Query Monitor are still the right first tools, and it is worth asking your host whether the account is hitting its resource limits.
Is it slow only some of the time?
Intermittent slowness has different suspects: other sites on the same shared server, backups or scheduled tasks running at busy times, traffic spikes, or bots hammering the site. Your hosting dashboard usually has resource graphs. If the slow moments line up with spikes there, the fix is on the server side rather than in your pages.
Write down what you find
Keep a simple record for each page you test: the date, the device, and the TTFB, LCP, INP and CLS values. Then change one thing at a time and test again. If you change five things at once and the site gets faster, you will not know which one worked, and if it gets slower you will not know which one to undo.
When to ask for help
Some findings are easy to act on yourself, such as compressing images or removing a plugin nobody uses. Others need experience: a slow server response after caching is already in place, a theme that is the source of the heavy scripts, or a database that needs careful cleaning. If your tests point there, it is worth having someone look at it before you spend money on the wrong fix.
That kind of audit is part of our systems and technology work. Send us your results and we will tell you what we would fix first, and whether it is worth fixing at all. If you are weighing up a bigger change, our guide to fixing or rebuilding a slow WordPress site covers how to decide.
Ditandai
Karya terkait
Di mana ini telah diterapkan.
Jasa Profesional
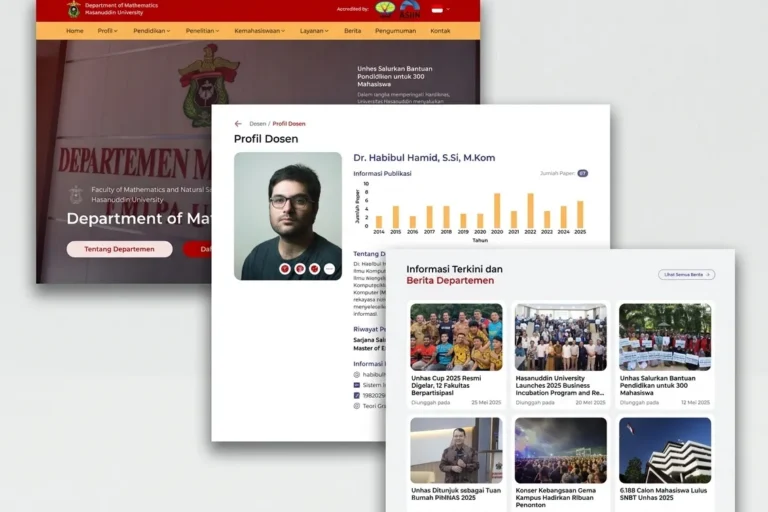
Departemen MIPA UNHAS
Universitas Hasanuddin
Website resmi departemen yang menyajikan informasi akademik, berita, dan kegiatan, dibangun agar staf dapat mengelolanya sendiri tanpa bantuan teknis.
Jasa Profesional
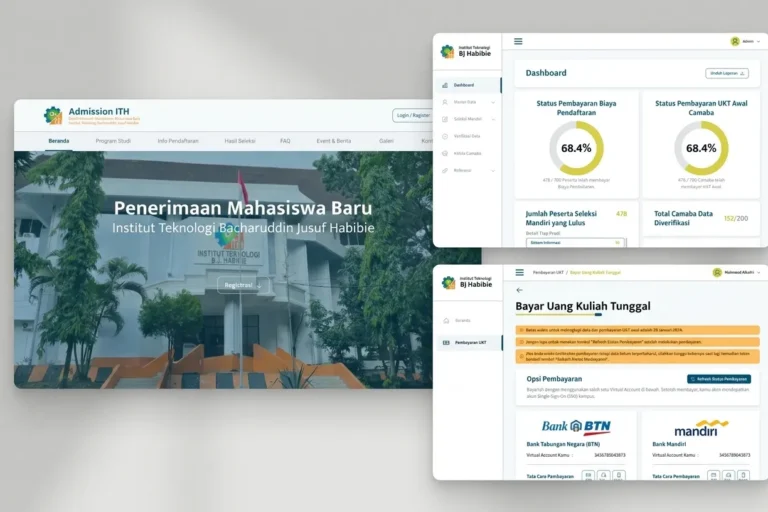
Admission ITH
Institut Teknologi BJ Habibie
Platform pendaftaran mahasiswa baru yang menangani seluruh proses pendaftaran secara online, mulai dari pengisian formulir, unggah dokumen, hingga pembayaran awal.
Local & Growing Businesses
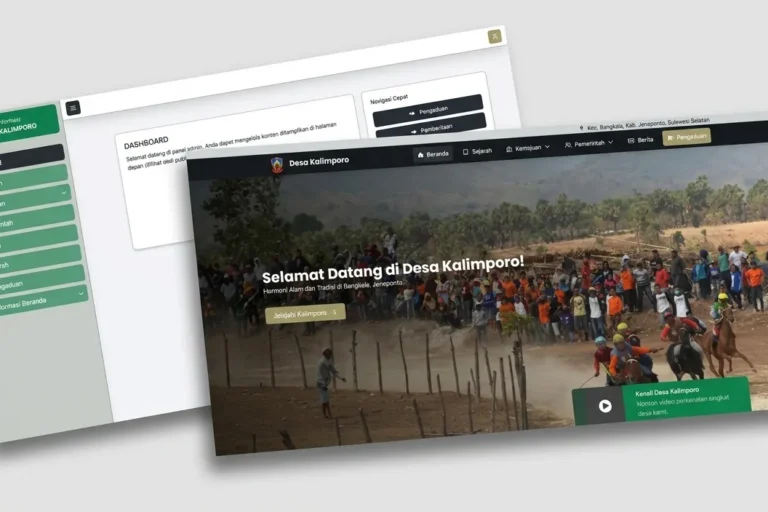
Desa Kalimporo
Desa Kalimporo
Platform profil desa yang menyajikan struktur pemerintahan, data kependudukan, potensi lokal, dan program desa kepada khalayak yang lebih luas.
Baca lebih lanjut
Artikel terkait.

Web Development
Who Owns Your Website? A Domain, Hosting and Login Checklist
Your domain, hosting, admin logins and Google accounts can each belong to a different person. A practical checklist so you know who holds the…

Web Development
Does Your Bali Business Need a Multilingual Website?
Should a Bali business website speak more than one language? How to decide from your own enquiries, and how to set it up so…

Web Development
WordPress Security for Small Businesses: A Plain-English Checklist
A plain-English WordPress security checklist for business owners: updates, plugins, passwords, backups, and what to ask your developer and host.